Concept
For the preparation and implementation of a GISsmox excursion the head of excursion, the lecturer and the GIS-group of the Department of Environmental Systems Science (D-USYS) work together.
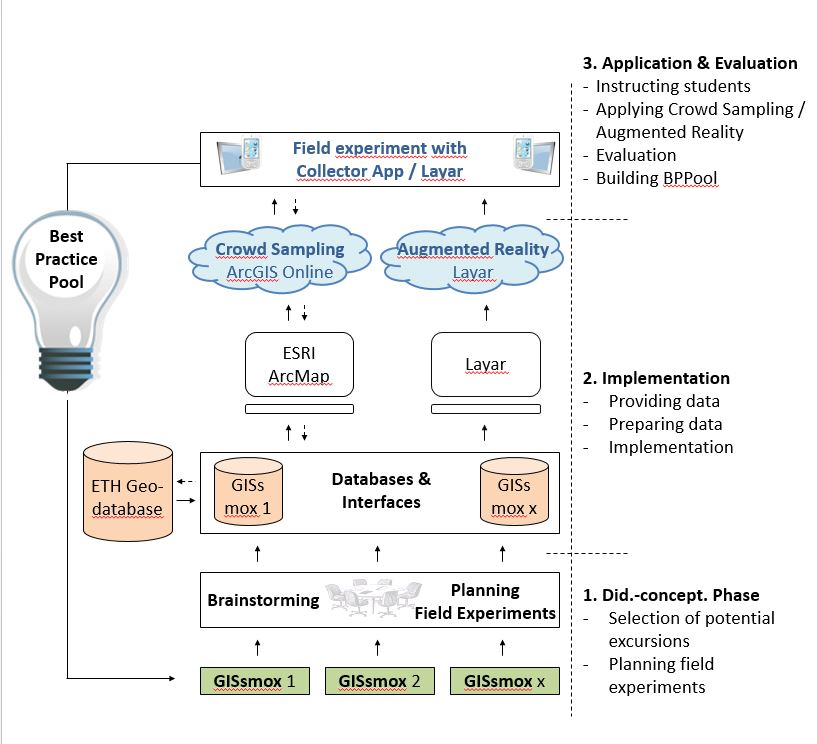
The following figure is a schematic representation that connects the sequence of the single phases with the didactic workflow and the technical architecture of a GISsmox excursion.
1. Didactic-conceptual phase:
Planning an excursion starts with a didactic-conceptual phase in which the lecturer and the head of excursion develop a first scenario. In this phase, the possibilities of enhancing the excursion on a didactic level with the use of mobile devices are explored and the data to be collected is decided on. In collaboration with the GIS-team the practical and technical feasibility is then examined and potential adaptations are made. Further, it is clarified if further instruments or permissions are necessary for recording the data.
2. Implementation:
After the conceptual phase, the implementation of the data structure follows. The conducts this step based on the Esri Software external page ArcGIS for Desktop. Furthermore, this step defines how the data to be recorded will be presented visually and how it should be processed after recording. As soon as this is completed, the data is transferred to the cloud-based content management system external page ArcGIS Online of Esri. Then it is made available to all students with the help of the external page Collector for ArcGIS (iOS, Android & Windows Phone) app.
3. Application and Evaluation:
Data Collection / Crowd Sampling Phase
Before every integrated excursion the students receive material and information on how to prepare for the excursion. For a GISsmox excursion they are additionally informed that they will record data with their smartphones and tablets. They are asked to install the freely available external page Collector for ArcGIS app on their mobile device.
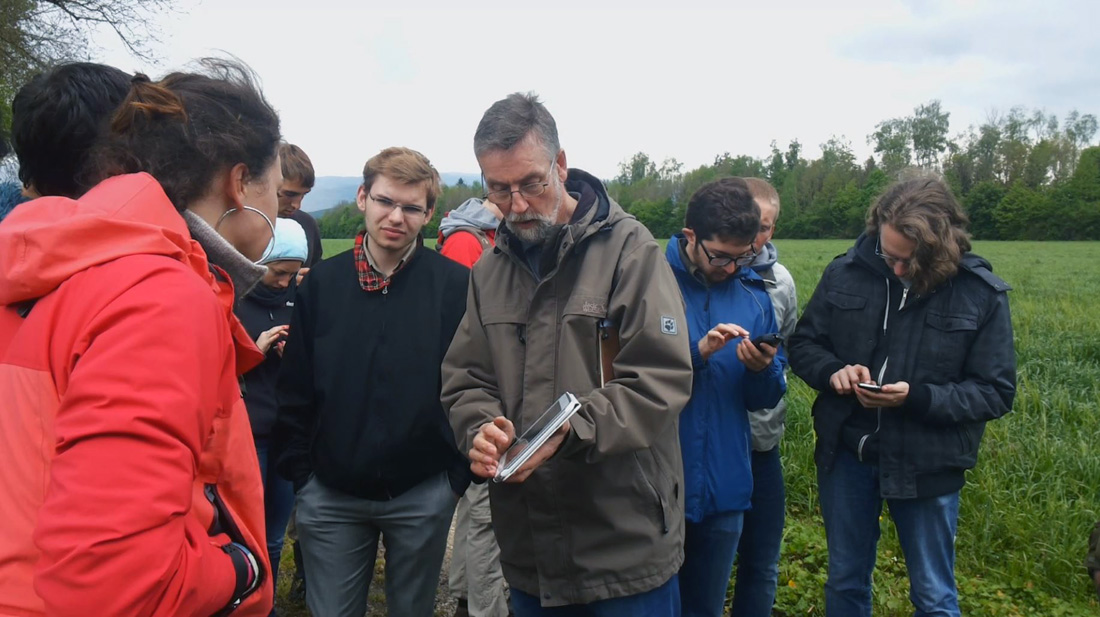
Data collection is conducted in groups of two so that the students can discuss the data survey and data input if for e.g. uncertainties in measurements exist. While the students record the required data into a mask, the GPS-receivers of their devices deliver the exact position of their recorded data points.
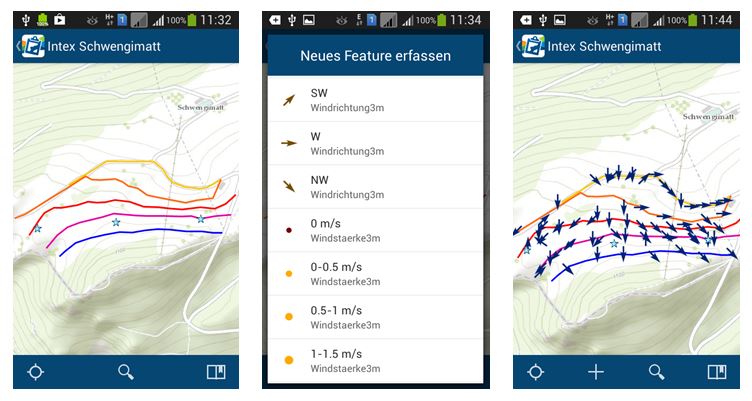
All participants can see in real-time where others collected data and what properties the collected objects possess. Like this an impression of the parameters of interest on the examined area can already be gained during the recording phase and first hypotheses can be formed and discussed by the recording teams (see following figure).
Analysis:
Immediately after data collection the students discuss and analyse the results based on prepared questions in groups and with the experts. The optimal didactic design of this evaluation phase is one of the core objectives of the GISsmox project.
Evaluation:
After every excursion an evaluation concerning the didactic enhancement and the acceptance of the new medium should follow. For this the opinions of the students as well as the head of excursion is collected. Information from conversations as well as observations during the excursions are also incorporated in the evaluation. Moreover, technical aspects should also be considered.
Post-processing:
The data collected by the students are transferred to a geodatabase by the GIS-team so that they can be reused the following year. Consequently, in addition to the spatial aspect the temporal aspect can be considered in future GISsmox excursions.


