Grand Marais
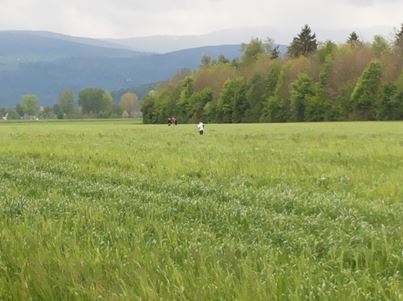
The intensive agricultural use of the Grand Marais leads to a depletion of topsoil and a sagging of soil by up to two meters. To make this loss visible and, therefore, more recognizable a field experiment was designed to show the students the high variability of topsoil over short distances.
Task
With the consent of the land owner the students were asked to determine the topsoil depth along pre-defined transects on a meadow in Grand Marais. The following questions were examined:
- How deep is the humus layer of this field?
- How variable is the depth of the topsoil?
- Is there a spatial pattern? If yes, is the pattern connected to land use history?
Field Experiment
Crowd-Sampling Phase
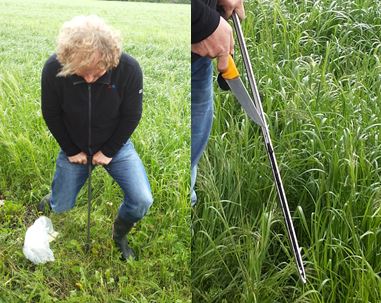
13 people as well as representatives of the Soil Protection Agency of the Canton of Bern took part in the field experiment. The extraction of soil samples was done in teams of two with the help of gravers.
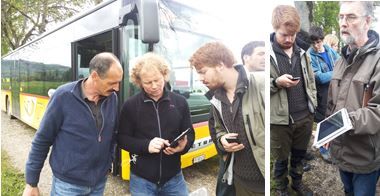
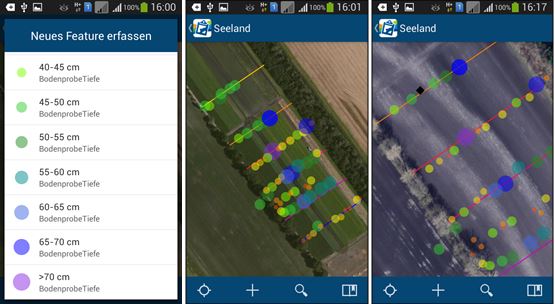
After around 5-10 minutes introduction on the use of the gravers and the app, the students had approximately 30 minutes to extract the soil profiles along their transects, determine the topsoil depth and insert the results in the app with the help of pre-defined values. The site of the transects as well as the points of extraction were localized with the help of the GPS function of the mobile devices. The soil samples were taken around every 10 m along the transect. The distance was estimated by stride length.
During the available time, around 67 (2015: 60) soil samples were taken. The recording of topsoil depth was done online and in real-time so that all students could see their collected data points as well as those of other groups as soon as they were recorded. The result is presented in the following:
Discussion
During the discussion which took place on site immediately after the experiment, the students comprehended what had been communicated to them theoretically: that not much of the former peat layer is left and that the remainder of the degraded peat varies strongly on short distances. The students spontaneously reported additional observations they made during the experiment such as differences in density, colouring, sand and clay content and humidity of the soil samples.
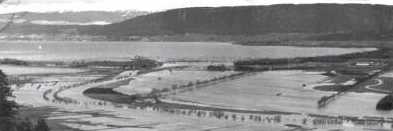
When overlaying the humus depth with an older arial image (see image under crowd-sampling phase) the former river bed reveals itself. During big floods it still emerges nowadays. These observations initiated an intensive discussion with the students about what can be undertaken against further depletion of topsoil in a former wetland with a regulated water table. Therefore, the experiment automatically lead back to one of the main topics of the excursion.
Feedback
The feedback of the students for this excursion was mainly positive. More than 90% of the participants indicated that they enjoyed the field experiment.
"The excursion was very interesting and I learned a lot through the active field work as well as the collaboration with experts on site."
The head of excursion also gave positive feedback: "GISsmox has more than served its purpose during our excursion in my opinion. Initially, I was very sceptical. But the result, especially this year, convinced me. My expectations were more than fulfilled and the students also enjoyed being able to do something on their own and not only having to listen." (Prof. Rainer Schulin, Institut für Terrestrische Ökosysteme, ETH Zürich, 2015).
Lessons Learned
Sampling leads to intensified discussion about soil. Through data collection the students were motivated to repeat the - in itself - "boring" process of extracting many samples and, therefore, came in direct contact with the variability of soil. 2015 the students were additionally informed in advance that the measurements could reveal the traces of a former river bed to give the experiment a clearer objective.
Orientation on terrain via GPS and offline maps. Because data connection was partially intermitted on site (also for the mobile access points) the groups could not always see the sampling points of other groups synchonously. In experiments where many measurements have to be taken on a small area the communication between groups about the chosen sampling position is important (for examples through intervisibility).
Incomplete instructions have an influence on data quality. When the experiment was conducted in 2015, the instructions were less detailed due to bad weather conditions. A first comparison of topsoil depth with the measurements of 2014 revealed consistently less humus depths for the measurements of 2015. During the discussion it became clear that soil samples were often extracted incompletely. As a consequence, a constructive discussion about data quality ensued.

