Renewable Energies
Wind direction and wind speed play an important role when searching for a suitable site for a wind power plant. With the help of a simple experiment the phenomenon wind is made tangible to students. The experiment was carried out on Schwengimatt (CH) where a bigger wind power plant is planned.
Task
The students are asked to record wind direction and wind speed along a slope in two different heights (1 m and 3 m above ground). The following questions are considered:
- How variable is wind close to the ground?
- Is the wind speed considerably higher at a height of 3 m compared to 1 m above ground?
- How is wind influenced by the terrain?
- How accurate are the recorded data?
Field Experiment
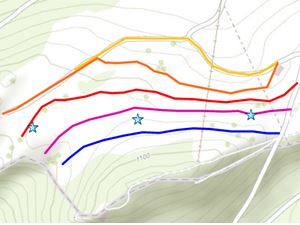
The recording of the two parameters wind direction and wind speed follows pre-defined transects.
The measurements are made approximately every 25 m. The distance is estimated by step length.
The adjacent figure shows the pre-defined transects. In addition, the positions of the potential wind turbines was plotted.
Crowd-Sampling Phase
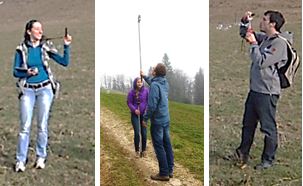
In total 26 students took part in the field experiment. The measurements were made in groups of 2 or 3. Each group was either responsible for measuring wind speed and wind direction at 1 m height or at 3 m height.
After a short introduction of the devices and the app the students had 30 minutes to record measurement points with the app. The students could see their current position on the display with the help of their GPS function with an accuracy of 2-3 m.
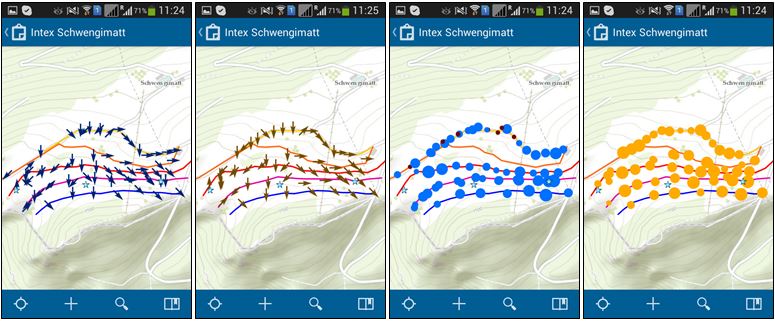
During the available time around 100 data points were recorded. The sampling occurred in real-time, therefore, the students could see their own progress as well as the measurements of the other excursion participants immediately. The results are depicted below:
Discussion
With the help of this simple experiment, the participants could see that the wind clearly follows the terrain. The wind speeds, in general, were quite low on this day. Nevertheless, the measurements showed that wind speed was lower 1 m above ground than 3 m above ground. In addition, the experiment revealed that wind can vary strongly on short distances. In general, the students could experience with this experiment that the right height of a wind turbine has a decisive influence on its productivity and, therefore, on its energy yield.
The measurements of 2015 show a systematic error in the wind direction measurements of one team thanks to a comparison with the data of other groups. This made a constructive discussion about data quality possible.
Feedback
"Renewable Energies" was the first excursion for which a field experiment with mobile data collection was planned. The students gave mostly positive feedback:
- "Through the experiment we could realize on our own how variable wind can be depending on the position and height."
- "A great thing, to save the data on the mobile phone. It was fun and the results were quite nice, so we could see well how the wind behaves close to the ground and how the terrain influences it."
- "During the self-conducted experiment I could remember the results very well. Better than having presented them theoretically."
Some students criticized that the experiment was not so much related to the actual topic of the excursion or that the measurements were conducted at a height where no wind turbines generates wind.
The head of excursion also gave positive feedback: "I was fascinated how a complex phenomenon - i.e. the variability of wind in a complex terrain - can be captured, visually presented and immediately discussed with a group of 30 students within a short period of time." (Prof. Heini Wernli, Institute for Atmosphere and Climate, ETH Zurich, 2014).
Lessons Learned
Choose the graphical representation of the results according to the questions asked. Easily readable representations (arrows, circles of different size) were intuitively readable by students and made it possible to immediately start with the interpretation.
Well organized beginning of measurements through head of excursion. The technical introduction and group formation took place during the bus drive to the site. Then, the head of excursion decided on site which route each group should follow. Like this no unnecessary delays ensued.
Evaluation in a room with tables for groups. In the first year, the evaluation of the results took place on the bus drive to the next site. Due to the seating arrangement and background noise little interaction took place during these evaluations. In 2015 the students were sitting around tables in groups. They had their devices with the results in front of them and discussed amongst each other and with the experts.
Timing of measurements and evaluation. Separating the measurements and the evaluation by a lunch break had organisational advantages (bathroom breaks) and enabled a smooth transition to the discussion because the students were already sitting together in groups.
Groups should be as small as possible. Two students were sufficient for carrying out measurements and recording the data with the Collector for ArcGIS app. Bigger groups were less focussed on the task.


