Distribution and environmental niche of Ailanthus altissima in Switzerland
This is a summary of the master thesis of Daniela Gurtner from the Department of Environmental Systems Science at ETH together with the external page Insubric Ecosystems research group at WSL.
The overall objectives of the thesis are:
- Map the current distribution of Ailanthus altissima in Switzerland
- Use the distribution to define the environmental niche
- Modelling of the possible habitats in Switzerland according to the niche
- Modelling of future habitat in Switzerland using scenarios for climate change from IPCC
Abstract
For several decades, the tree of heaven, Ailanthus altissima (Mill.) Swingle, a tree species native to China and North Vietnam, is invading ecosystems around the globe. A. altissima was planted due to its beautiful foliage and the resistance to drought and salt in several cities and gardens all over the world, from where it started to naturalize. The tree species has an enormous potential to occupy new habitats as a result of its broad climatic range, a large amount of primarily wind-dispersed seeds and a pronounced ability to sprout from roots or stumps. Once established, A. altissima is difficult to remove. In Switzerland, this early successional tree particularly invades sweet chestnut, Castanea sativa (Mill.) stands in Ticino and Val Mesolcina. Recently, the tree has also started to spread from urban areas into forests north of the Swiss Alps. However, the extent of the current distribution and the invasion front of A. altissima in Switzerland remain uncertain. Hence, there is a lack of information on its environmental niche and potential habitat under current and future climate. To gain a better estimate of the current colonization and also the ecological processes and environmental conditions that control the invasion, presence data was analysed and used to characterize and project its present and future environmental niche.
Field Campaign
The field campaign took place during the first three weeks of October 2014 in Ticino. During this time period, regions with poor A. altissima data coverage were visited and all trees mapped with an app of esri ArcGIS. Thus it was possible to complement two existing data sets on the A. altissima distribution: The first data base was created by M. Anzini, Forest division of the canton of Ticino. M. Anzini collected data from forest services in the canton of Ticino and partly verified this presence data with field visits. The second data base was created by G. Mombelli, Insubric Ecosystems group at the WSL Bellinzona. G. Mombelli used a standardized survey for A. altissima with attributes to describe the habitat as described by M Conedera et al. (2012). A simplification of this survey was used by M. Anzini and the forest services of canton Ticino in order to be able to cover a larger area. This simplified survey was used for the fieldwork in this thesis because most of the data for Ticino were available with those attributes only and it was sufficient for the purposes of this study.
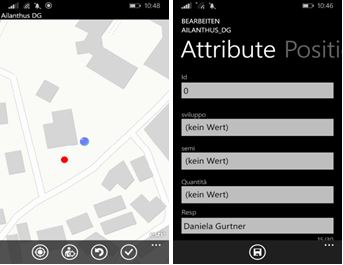
The Esri ArcGIS app for smartphones was used in the field on a Windows phone 8. It is an online application for creating and editing spatial data. It is based on esri’s ArcMap (Esri, 2014), a program to compile and manage spatial data and conduct spatial analysis. The attribute table was built with the same attributes as the survey conducted by M. Anzini (Table 1). The shapefiles of the existing data were also loaded into the online map in order to prevent duplicated data.
Table 1: Attributes for the ArcGIS app
The ID was given according to the size of the population. ID 1 meant a single tree or a group of less than 10 trees or more in cases where it was obvious that all the smaller trees were root sprouts or shoots from the stump of one single mother tree. ID 2 was given to larger populations and forest stands. Populations were recorded as points although there was a possibility to create polygons on the smartphone. Due to the small display size it was decided to draw them manually on topographic maps.

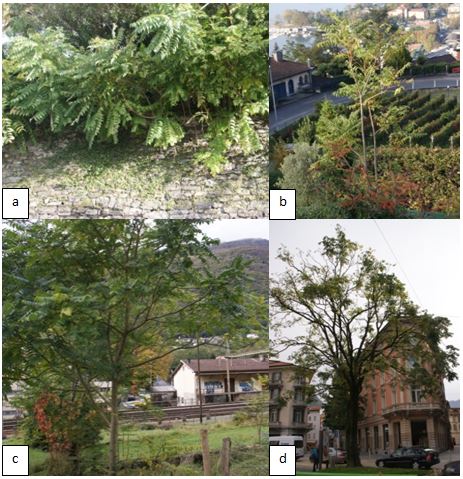
Sometimes the edges of a population were marked as points and polygons were drawn afterwards. The field “responsible[JW1] ” was set to Daniela Gurtner as a default, but it was still possible to change that in case someone would tell me about presences in other places. The year was always 2014. This attribute allows a temporal comparison to other data, definition of the survival rate and also allows control of eradication measures. There were four development stages according to the DBH (Figure 1): 00-4 cm (class a), 4-12 cm (class b), 12-30 cm (class c) and >30 cm (class d). .Seedlings smaller than 40 cm in height were not recorded. The[JW2] stem number was divided into two categories: single or group. For the populations, this field was left empty.The presence of seeds was judged by in situ observation. When a tree was given this attribute, it was a female tree. However, if no seeds were observed, the tree could still have been a female tree that has already lost its fruits or had not yet developed any. A. altissima develops fruits at an age of 3-5 years and their fruits are usually visible until February (Kowarik & Säumel, 2007). Positioning was possible through GPS on the phone or manually by touching the screen (red dot in Figure 2).
This way, an exact positing was possible even in forests and on steep slopes where GPS usually has a low accuracy. The manual positioning allowed to record the location in places the phone has no reception.
Only occasional trees were recorded later and in other regions of Switzerland when passing by. Some observed trees were documented and later used to compare with the model output or to judge the completeness of the external data.

Results
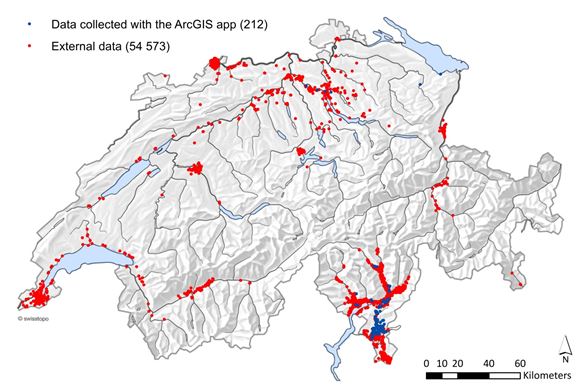
The utilization of this app, sharply reduced the data processing time. A map was created based on both the newly collected and existing data (Figure 3).

The spatial analysis started right away. It was possible to define the elevation range, exposition and slope of the sites and also the climatic niche using gridded climate data. Another important task was to define whether trees grow in the forest or not and how far they are growing from infrastructures like roads or railroads. The acquired data was again the starting point for a species distribution model (SDM). external page MaxEnt was used in order to create a model of the possible distribution according to the niche. The model showed that the annual average temperature is the strongest predictor on A. altissima presence. This relationship allowed to project the distribution into future conditions characterized by warmer temperatures.
Further information:
Gurtner, D., Conedera, M., Rigling, A., Wunder, J. (2015): external page Götterbaum dringt im Schweizer Wald vor. Waldwissen.net
Gurtner, D. 2015. Distribution and environmental niche of invasive Ailanthus altissima in Switzerland. Master thesis ETHZ
Conedera, M., Baumgartner, F., Anzini, M. (2012). Erfassung von Neophyten. Das Beispiel des Götterbaumes. Bündnerwald 65: 41–45
Kowarik, I., & Säumel, I. (2007). Biological flora of Central Europe: Ailanthus altissima (Mill.) Swingle. Perspectives in Plant Ecology, Evolution and Systematics, 8(4), 207-237.